

How to Apply to The Data School
Applying to The Data School differs from a traditional corporate recruitment workflow. Academic transcripts and CVs alone do not predict future consulting performance because our selection methodology evaluates aptitude, problem-solving capability, and technical potential. We assess how you approach raw datasets, formulate analytical questions, and communicate visual findings clearly. Consequently, building an original Tableau Public Dashboard forms an integral part of your application. Your submission does not need to be technically advanced; its purpose is to demonstrate your analytical curiosity, logical reasoning, and capacity for growth.
The Step by Step
Selection Process

Discover The Data School
Before submitting your application, we encourage candidates to attend our Meet & Greet events, university presentations, or virtual info sessions. These events provide transparent insights into the 29-month curriculum, client placement structure, and daily life as a Data School Consultant, allowing you to ask questions directly to active cohort members.
Build & Publish Your Application Dashboard
Download free Tableau Public Desktop software, select a raw dataset that aligns with your personal interests, and construct an interactive visual dashboard. Publish your completed visualisation to your free Tableau Public profile.
Submit Your Application Documents
Submit your formal application through our recruitment portal, including your CV, cover letter, relevant academic or vocational certificates, and the live link to your published Tableau Public dashboard.
Incorporate Constructive Feedback
Following initial review, our technical team provides feedback on your dashboard’s visual layout, chart selection, and analytical logic. You will submit a revised iteration based on this feedback. This stage evaluates how you process constructive critique, adapt your approach, and apply technical advice.
Digital Phone Screen
Candidates with strong initial submissions are invited to a 30-minute digital interview conducted in German and English. You will present your application dashboard, explain your analytical reasoning, outline key findings, and discuss your motivation for entering BI consulting.
Final Interview Day in Hamburg
Successful candidates advance to the final interview stage in Hamburg. Ten days prior to the interview day, all finalists receive an identical dataset simultaneously to construct a new dashboard from scratch. During this ten-day preparation window, candidates can request technical feedback and guidance from active Data School Consultants. On the final interview day, you present your dashboard on-site to our selection panel.
Cohort Onboarding
Selection feedback is delivered shortly after the final interviews conclude. New cohorts commence their four-month intensive training phase in Hamburg approximately one month following the final interview round.
Practical Tipps
for Your Submission
Your application dashboard is your opportunity to showcase structured thinking, visual design awareness, and enthusiasm for data. Select a topic that genuinely interests you; the dataset does not require a commercial background, provided it offers sufficient analytical depth.
- Focus on Visual Data Storytelling
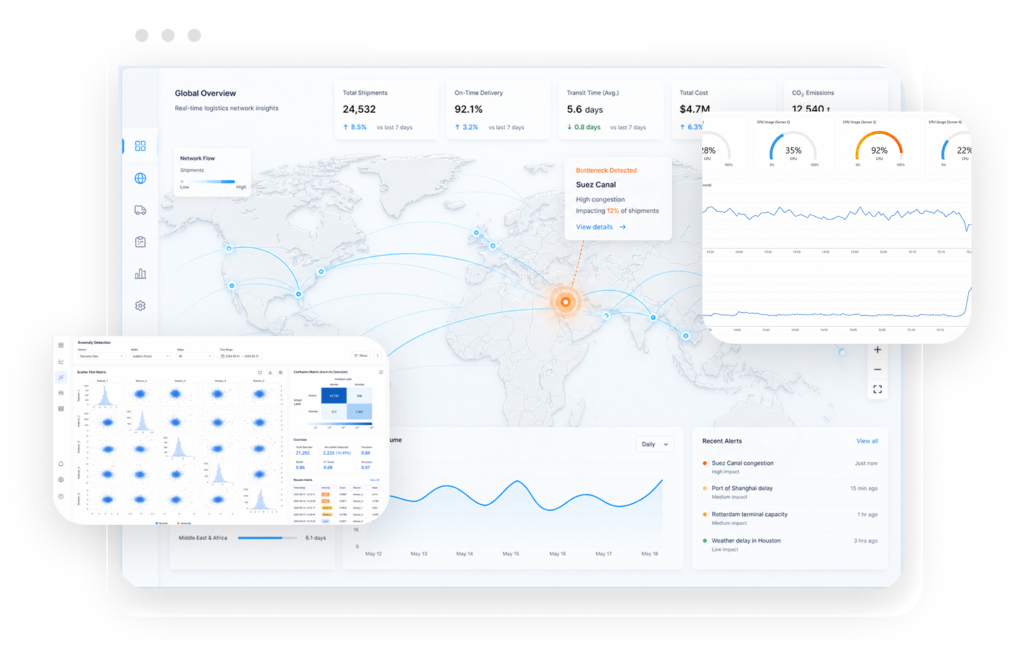
Ensure your dashboard tells a coherent story rather than displaying isolated charts. Define a clear analytical question, highlight underlying trends or anomalies, and guide the reader toward actionable conclusions. - Avoid Generic Datasets
Do not use Tableau’s standard “Superstore” sample dataset, and do not replicate existing dashboards from online tutorials. We evaluate original analytical ideas and individual initiative. - Leverage Community Resources Review our technical blog articles and community guides for advice on dataset selection, dashboard formatting, and visual layout best practices.
How to Tackle Your Application
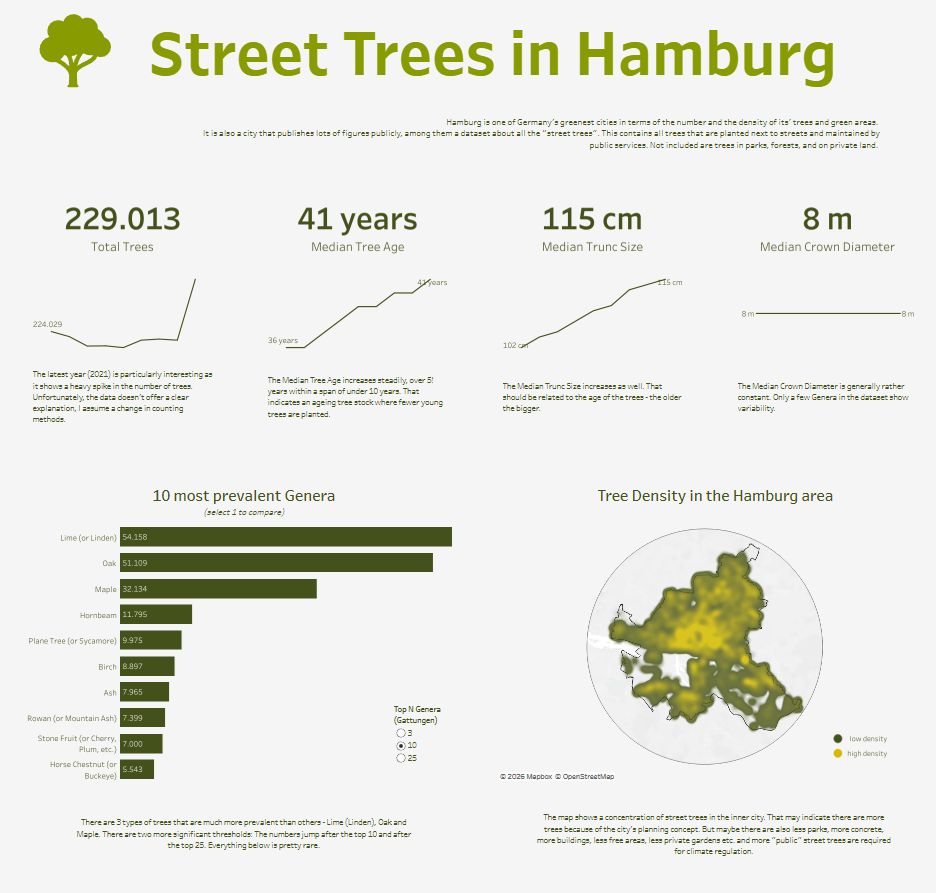
Applying to become a Data School Consultant at The Information Lab is anything but a standard application process. Our process includes an aptitude-based stage in which you receive valuable feedback directly from us. This means that even during the application process, you have the opportunity to develop your skills and learn from our feedback.
At the heart of the application is the creation and submission of an interactive Tableau dashboard. Many applicants ask themselves: “Where do I even start? I’ve never used Tableau before!” Don’t worry. Our “Tableau Unlocked” blog series guides you through the process step by step and helps make getting started with Tableau much easier.
Tableau
Unlocked Series
- Getting Started: An Overview
In this blog post, one of our consultants shares their personal experience of the Data School application process. - From Idea to Concept
This blog post introduces one way to sketch out your ideas before you start building your dashboard. If you are looking for more specific guidance, this article covers some of the key dos when creating your dashboard. It is equally useful to know what to avoid when preparing a submission for us. Here you will find helpful tips on common don’ts. - Putting It into Practice: Visualising Data
This blog post explains how to create a dashboard and what to consider while building it. This post also gives you an overview of when bar charts and line charts are most appropriate. - Interactivity: Bringing Your Analytical Thinking to Life
In this post, you can learn more about adding interactivity to your visualisations. This article explains different ways to customise filters. We also have another blog post showing further options for formatting filters. - The Finishing Touches: Context and Usability
This article shows you how to format BANs and KPIs for use in your dashboard. In this post, you will find guidance on formatting tooltips. If you are happy with the formatting but your dashboard still feels a little crowded, you can use Show/Hide buttons in Tableau. You can find a step-by-step guide to using them here.
The Data School Blog

Ready to Apply?
You do not need to be an expert yet. What matters is that your interest in data comes through and that you are open to feedback, learning and developing your skills.
Hamburg
Full-time
The Data School is part of The Information Lab Deutschland GmbH and trains the next generation of data analysts using leading …
Frequently Asked Questions
Why is a traditional CV insufficient for Data School admissions?
Academic transcripts and CV metrics offer limited visibility into how you approach real-world problem-solving. While an accredited university degree or completed vocational training is a prerequisite, our selection methodology focuses primarily on your analytical potential. The required Tableau Public dashboard allows us to observe how you ask questions of a dataset, reason logically, and translate complex figures into clear visual formats.
Does my Tableau Public dashboard need to be technically advanced?
No. Many applicants utilise visual analytics software for the first time during their application. We do not expect advanced technical mastery, the necessary software proficiency is taught thoroughly during the first four months in Hamburg. We evaluate whether you have investigated a topic logically, structured a clear visual narrative, and presented your findings coherently.
Which dataset should I select for my initial dashboard?
Select a topic that aligns with your personal interests, whether sports statistics, environmental metrics, pop culture, economics, or public infrastructure. Personal interest yields deeper analytical questions and more compelling visual storytelling. Important: Avoid using the default Tableau “Superstore” dataset and do not copy YouTube tutorial dashboards. We want to evaluate your original ideas.
What happens after I submit my initial dashboard?
We do not reject applications based solely on initial formatting flaws. After your submission, our team provides constructive technical feedback on your dashboard. You then have the opportunity to refine your visualisation and submit an updated version. This evaluates how effectively you incorporate feedback and apply advice, a vital capability for a consulting career.
How is the Final Interview Day in Hamburg structured?
Candidates who pass the digital phone screen are invited to our Hamburg hub for the final interview. Ten days prior to the event, all finalists receive a new dataset simultaneously to construct a fresh dashboard. During these ten days, you can consult with active Data School Consultants to refine your work. On interview day, you present your findings on-site and discuss your work with our panel.
